Stop Paying the "Distance Tax" – Real-Time CO2 Intelligence is Here
Article • February 5, 2026 • 2 min read
Cloudprinter.com launches a real-time Carbon Reporting Tool with verified CarbonQuota data, giving brands full visibility into per-order CO₂ emissions and reducing print-related carbon by up to 99.5% through local production.
Print a poster in Germany. Ship it to a customer in Spain. That shipment carries a carbon cost that nobody sees on the invoice. It hides in the transport, the handling, the kilometers between factory and doorstep.
We call it the Distance Tax. It costs money. It costs time. And it costs carbon. Today, we make that cost visible.
Cloudprinter.com launches a real-time Carbon Reporting Tool inside the Brand Portal and Enterprise Dashboard. The emission data behind it is verified by CarbonQuota, the carbon management specialist for the print and packaging industry. Every order now carries its own carbon footprint. Not an estimate. Verified data.
What 100,000 Orders Told Us
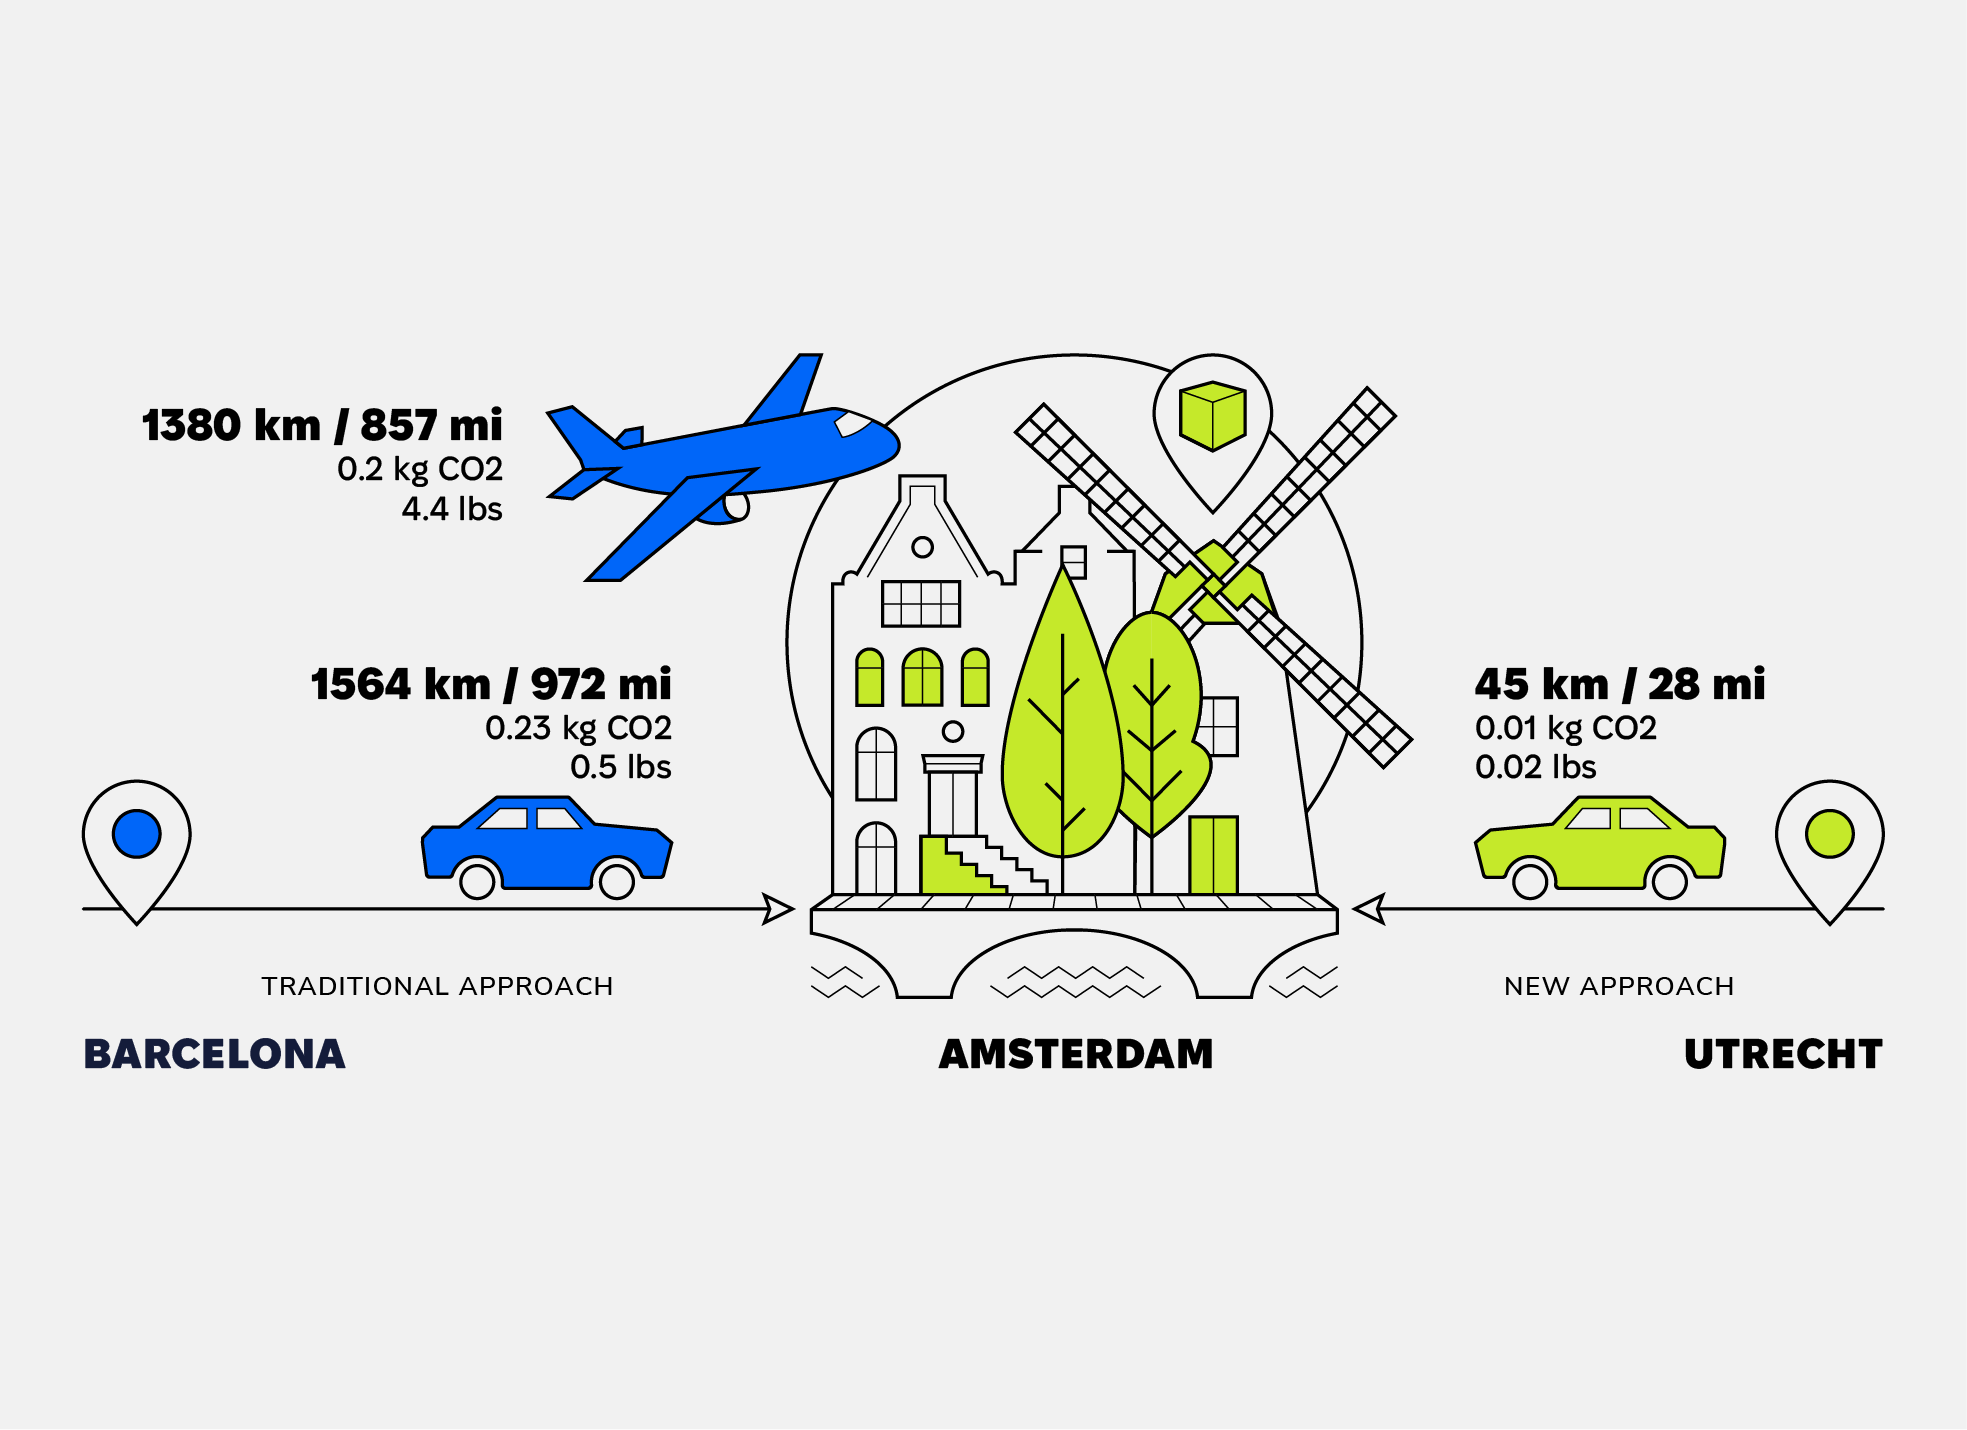
We analyzed 100,000 legacy orders from brands that used to rely on centralized production. One facility, shipping worldwide. Often by air.
The data was clear. Air-freighted print products carry nearly 200 times the carbon footprint of locally produced equivalents. Two hundred times. For the same poster. The same calendar. The same flyer.
Brands that switched to Cloudprinter's local production network reduced their printrelated carbon emissions by at least 95%. In most cases, up to 99.5%.
Until now, that data stayed in our internal analyses. The Carbon Reporting Tool puts it in the hands of the brands themselves.
Verified Data, Not Guesswork
The emission data comes from CarbonQuota, whose carbon accounting platform is built specifically for the print and packaging sector. CarbonQuota calculates verified emissions at the production level: materials, energy use, and transport. Cloudprinter integrates that data into every order, accessible in real time.
The tool tracks total CO2 across all print and shipping activity, broken down by product category. Calendars. Posters. Flyers. Books. Brands can monitor average emissions per order over time and benchmark their performance.
For companies facing tightening ESG disclosure requirements under EU CSRD and upcoming US SEC climate rules, the difference between an estimate and verified data is the difference between a marketing claim and a compliance-ready report.
Building the Infrastructure to Go Lower
The carbon tool arrives as we build the physical infrastructure to push those numbers even further down. In January, we announced a rollout of proprietary Print Fulfillment Centers across the US and Europe.
The first facility in Europe is already operational. Tucson, Arizona opens in April 2026. Malaga, Spain follows in Q2 2026. Additional centers are planned in the UK, Germany, France, and the Netherlands. The target: 18 Print Fulfillment Centers in the US alone by mid-2027.
Each new facility shrinks the distance between printer and customer. Combined with our existing network of 381 print locations across 104 countries, the goal is Shipping Zone 1 Proximity for every order. Production next door. Delivery next day.
The Carbon Reporting Tool closes the loop. As each new Print Fulfillment Center comes online, CarbonQuota's verified data captures the impact in real time. Brands can track exactly how expanding local production reduces their carbon footprint, order by order.
"We are building the infrastructure to kill the Distance Tax. New Print Fulfillment Centers across the US and Europe bring production closer. With CarbonQuota's verified data now integrated into every order, brands don't have to take our word for it. They can see exactly what local production delivers."
Martijn Eier, CEO of Cloudprinter.com
What Comes Next
This is the first release. It covers paper-based materials. A second phase is in preparation, adding emission data for transport modes, paper types, and specialized printing processes, all verified through CarbonQuota's methodology.
As new Print Fulfillment Centers come online throughout 2026 and 2027, the data will reflect the network's expanding capacity in real time. The goal: full transparency across every layer of the print supply chain.


